
SOLUTION - PowerPoint PPT Presentation
1 / 7
Title:
SOLUTION
Description:
EXAMPLE 1. Graph a rational function of the form y = a. x. Graph ... Draw the asymptotes x ... Draw the branches of the hyperbola so that they pass through the ... – PowerPoint PPT presentation
Number of Views:36
Avg rating:3.0/5.0
Title: SOLUTION
1
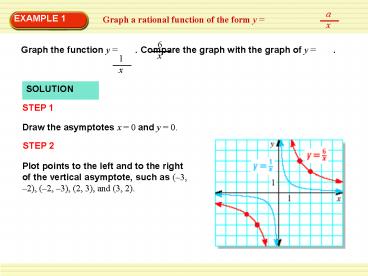
EXAMPLE 1
SOLUTION
STEP 1
Draw the asymptotes x 0 and y 0.
STEP 2
Plot points to the left and to the right of the
vertical asymptote, such as (3, 2), (2, 3),
(2, 3), and (3, 2).
2
EXAMPLE 1
STEP 3
Draw the branches of the hyperbola so that they
pass through the plotted points and approach the
asymptotes.
Both graphs lie in the first and third quadrants
and have the same asymptotes, domain, and range.
3
EXAMPLE 2
SOLUTION
STEP 1
Draw the asymptotes x 2 and y 1.
STEP 2
4
EXAMPLE 2
STEP 3
Draw the two branches of the hyperbola so that
they pass through the plotted points and approach
the asymptotes.
The domain is all real numbers except 2, and
the range is all real numbers except 1.
5
for Examples 1 and 2
GUIDED PRACTICE
Graph the function. State the domain and range.
SOLUTION
6
for Examples 1 and 2
GUIDED PRACTICE
Graph the function. State the domain and range.
SOLUTION
7
for Examples 1 and 2
GUIDED PRACTICE
Graph the function. State the domain and range.
SOLUTION
Recommended
CrystalGraphics Presentations


