Gradient Microstructure and Phase Characterization - PowerPoint PPT Presentation
1 / 1
Title: Gradient Microstructure and Phase Characterization
1
Gradient Microstructure and Phase
Characterization of Solid Oxide Fuel Cell Layers
A.J. Allen1, T.A. Dobbins1, J Ilavsky1,2, G.G.
Long1, J. Almer3, D. Haeffner3, F. DeCarlo3 1.
Ceramics Division, Materials Science and
Engineering Laboratory, NIST, Gaithersburg, MD
20899 2. Dept. of Chemical Engineering, Purdue
University, West Lafayette, IN 47907 3. X-ray
Operations and Research, Advanced Photon Source,
Argonne National Laboratory, Argonne, IL 60439.
Small-Angle X-ray Scattering
Motivation
Functional gradient materials depend on complex
superpositions of spatial gradients in void
morphology and structural phase composition.
Quantifying these gradients improves
understanding of the underlying phenomena that
govern material properties. The microstructures
must frequently be characterized from nanometer
to micrometer scale dimensions. Recently,
ultrasmall-angle x-ray scattering (USAXS)
measurements at UNI-CAT, sector 33-ID have
determined the void microstructures over the full
scale range (with a spatial resolution of 40
micrometers) in solid oxide fuel cell (SOFC)
layers, and have revealed microstructure
variation within the cathode and anode layers
near and far from the thin electrolyte. These
studies have been complemented by high-energy
small-angle X-ray scattering (HESAXS) experiments
at XOR, sector 1-ID, which have achieved a
spatial correspondence of the SAXS-determined
fine void structure and the wide-angle x-ray
diffraction (WAXD)-determined phase composition
to an unprecedented spatial resolution of 5
micrometers. This is sufficient to determine
critical micro-scale variations in phase and
porosity close to the SOFC electrolyte layer.
Computed X-ray microtomography (XMT) studies of
the same SOFC material at XOR sector 2-BM using
different x-ray energies have revealed the coarse
void morphology, the phase segregation in the
SOFC anode, and also verified the location and
integrity of the buried thin electrolyte layer.
Scattered intensities for SAXS from voids are
proportional to their scattering contrasts with
the solid phases. The calculated scattering
contrasts for x-rays, Dr2, are given by
- USAXS sector 33-ID
- Modified ultrasmall-angle x-ray scattering
(USAXS) with pin-hole collimation - X-ray energy 16.9 keV (wavelength 0.0735 nm)
- Slit height (spatial resolution perpendicular to
- the interfaces) 41.3 mm
- Sample thickness 248 mm
HESAXS combined with WAXD sector 1-ID
(a)
- Absorption and background scattering, as well as
SAXS and WAXD, can be used to determine the
locations of the electrode/electrolyte
interfaces. - For perfect sample and interface alignment, the
Porod surface area should drop to near zero
within the dense YSZ electrolyte. - Some of the scattering in the anode arises from
the YSZ/Ni-NiO phase separation.
surface x-ray scattering
catalysis/reactivity
TEM/x-ray/neutron diffraction
interface phase equilibrium
Ni-NiO/YSZ
LSM
ANODE
CATHODE
XMT / SAXS
void microstructure characterization
(b)
SOFC transport properties, performance.
YSZ ELECTROLYTE
m
Position (
m)
(c)
LSM
Ni-NiO/YSZ
Porod Surface Area (m2 cm-3)
CATHODE
ANODE
(d)
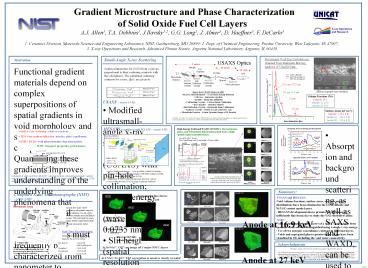
Schematic of solid oxide fuel cell (SOFC) showing
cathode, electrolyte and anode, together with the
fuel flow. Among a range of relevant electron,
neutron and x-ray techniques, XMT and SAXS are
presented here.
YSZ ELECTROLYTE
SAXS
WAXD
m
Position (
m)
Summary
Computed X-ray Microtomography (XMT) sector
2-BM
- USAXS and HESAXS
- Void volume fractions, surface areas, and sub-mm
size distributions have been obtained in the LSM
cathode and Ni/YSZ cermet anode layers. - HESAXS development shows promise for obtaining a
sufficiently fine beam size to study the YSZ
electrolyte alone.
- XMT
- Void morphologies in all 3 layers of a SOFC
section have been - spatially-resolved and distinguished using a
single x-ray energy. - Use of two energies can enhance contrast in
different layers. - Voids and segregated phases greater than 1 mm
have been - visualized in 3D, including the void
inter-connectivity.
Anode at 16.9 keV
At 16.9 keV, XMT can image all 3 major SOFC
layers. At 27 keV, Ni-NiO / YSZ segregation
in anode is clearly revealed
Anode at 27 keV
4/30/03


