
Reading Ternary Diagrams - PowerPoint PPT Presentation
1 / 8
Title: Reading Ternary Diagrams
1
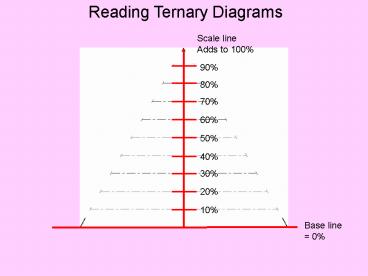
Reading Ternary Diagrams
Scale line Adds to 100
90
80
70
60
50
40
30
20
10
Base line 0
2
Reading Ternary Diagrams
100
90
80
70
60
50
40
30
20
10
3
Reading Ternary Diagrams
100
90
80
70
60
50
40
30
20
10
4
Reading Ternary Diagrams
5
Reading Ternary Diagrams
6
Reading Ternary Diagrams
7
Reading Ternary Diagrams
A
SS SH LS
50
20
30
A
8
Reading Ternary Diagrams
A
SS SH LS
50
D
20
SS SH LS
20
30
40
C
B
40
SS SH LS
10
70
20
A
C
SS SH LS
80
20
00
D
B
9
Sedimentary Rock Classification
Clastics
Carbonates
10
How You Classify It Is How You Think About It
Lynn S. Fichter, Department of Geology and
Environmental Science, James Madison University.
2006
Contact Information
http//csmres.jmu.edu/geollab/Fichter/Fichter/Fich
terls.html
Recommended
CrystalGraphics Presentations


![[VII]. Regulation of Gene Expression Via Signal Transduction PowerPoint PPT Presentation](https://s3.amazonaws.com/images.powershow.com/4917995.th0.jpg?_=20131220041)


