BOLD functional MRI
1 / 30
Title:
BOLD functional MRI
Description:
BOLD functional MRI. Magnetic properties of oxyhemoglobin and deoxyhemoglobin ... isomagnetic with respect to the surrounding tissue. Magnetic Susceptibility ... –
Number of Views:334
Avg rating:3.0/5.0
Title: BOLD functional MRI
1
BOLD functional MRI
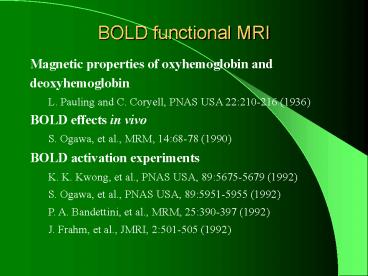
Magnetic properties of oxyhemoglobin and
deoxyhemoglobin L. Pauling and C. Coryell, PNAS
USA 22210-216 (1936) BOLD effects in vivo S.
Ogawa, et al., MRM, 1468-78 (1990) BOLD
activation experiments K. K. Kwong, et al., PNAS
USA, 895675-5679 (1992) S. Ogawa, et al., PNAS
USA, 895951-5955 (1992) P. A. Bandettini, et
al., MRM, 25390-397 (1992) J. Frahm, et al.,
JMRI, 2501-505 (1992)
2
Mechanism of BOLD Functional MRI
Brain activity
Oxygen consumption
Cerebral blood flow
Oxyhemoglobin Deoxyhemoglobin
Magnetic susceptibility
T2
MRI signal intesity
3
Magnetic Properties of Oxyhemoglobin and
Deoxyhemoglobin
Deoxyhemoglobin paramagnetic (c gt 0)
paramagnetic with respect to the surrounding
tissue Oxyhemoglobin diamagnetic (c lt 0)
isomagnetic with respect to the surrounding
tissue
4
Magnetic Susceptibility
5
Oxyhemoglobin and Deoxyhemoglobin in Veins during
Brain Activation
Activation
Rest
Normal blood flow
High blood flow
Oxyhemoglobin Deoxyhemoglobin
6
T2 Effect in fMRI
action
MR signal (S)
rest
TE
t
reception
excitation
7
Time Series and Activation Maps
Signal Intensity
Off
Off
Off
Off
On
On
On
On
Scan Number
8
Challenges in Functional FMRI
Sensitivity (Contrast-to-noise ratio) BOLD
signal change is 1-2 at 1.5 T signal-to-noise
ratio in single-shot EPI images is
100. Physiological pulsations (cardiac and
respiratory) Head motion instrumental
instability Specificity Location of activation
neurons or veins Susceptibility artifacts
9
Challenges in Functional FMRI
Temporal resolution Limited by BOLD
impulse-response function, image sampling rate,
and spin relaxation times Spatial
resolution Limited by BOLD point-spread
function, signal-to-noise ratio, and image
sampling rate Non-linearity Neurological and
hemodynamic Acoustic noise
10
Contrast-to-Noise Ratio
Brain Activation-related signal
change Sensitivity Temporal fluctuation
of image intensity
11
Enhancement of BOLD Contrast
Higher magnetic fields BOLD signal change DS Ba
(1 lt a lt 2) Standard clinical MRI scanner at 1.5
T Research scanner up to 8 T currently Optimizat
ion of image acquisition parameters Optimal echo
time (TE) to maximize BOLD signal Optimal
repetition time (TR) to increase number of images
acquired per unit time, and to decrease motion
artifacts
12
TE Dependence of Signal Change
TE
13
Suppression of Temporal Fluctuations
Head motion reduction Head holder modified from a
football helmet Image realignment in data
processing Physiological pulsations Correction
using simultaneously recorded cardiac and
respiratory signals Ultra-fast imaging
techniques Single-shot echo-planner imaging
(EPI) Single-shot Spiral imaging Post-processing D
enoising
14
Ultra-Fast Spiral Scanning
Fast An image (64x64) can be acquired in 20
ms Reduce head motion Increase number of images
collected per unit time Stable Spiral trajectory
is insensitive to motion and flow artifacts Zero
gradient moments at the center of k-space
(self-navigated) First-order gradient moments
vary smoothly over k-space
15
Multi-Slice Spiral Images
16
Multi-Slice EPI Images
17
Activation Maps on Anatomical Images
MS Spiral
MS EPI
3D Spiral
18
Histograms of Temporal Standard Deviations
80 60 40 20 0
MS-Spiral
MS-EPI
3D-Spiral
Number of Activated Voxels
0 0.01
0.02 0.03
0.04
SD/Mean
19
Comparison of Activation Studies Using MS-spiral,
MS-EPI, and 3D-spiral
20
Specificity in fMRI
- Inflow Effects
- Generated by fresh (fully recovered) spins moving
into the region excited under saturating
conditions - Flow change in large vessels can lead to
substantial signal increases (20-30), and
compromise spatial accuracy in activation studies
21
Inflow Effects in fMRI
Suppression of inflowing spins
No suppression of inflowing spins
22
Gradient Echo vs. Spin Echo in fMRI
- Contribution of large vessels and capillary beds
to the BOLD signals - Separation/suppression of signals from large
vessels.
23
Temporal resolution
Impulse-response function
12s
5s
2s
t
24
Temporal resolution
- Sampling rate (single-shot EPI 10-15 slices/sec)
- Whole brain (30 4mm-slices) 2-3 sec
- T1 relaxation times
- Grey matter 1 sec
- White matter 0.8 sec
- CSF 2-3 sec
25
Spatial resolution
- BOLD point-spread function
- Spatial extent of neuronal activity, CBF, and
BOLD - Image spatial resolution
- 64x64 with FOV 240 mm 3.75mm
- 128x128 with FOV 240 mm 1.875 mm
- Signal-to-noise ration
- Single-shot EPI with voxel size 4x4x4 mm3 100
26
Non-linearity of BOLD Response
BOLD response vs. length of stimulation
t
2t
BOLD response during rapidly-repeated stimulation
ts
27
Experimental Designs in fMRI
Block-Design fMRI
Task
Rest
20-60s
Event-Related fMRI
8-12s
28
Hemodynamic Response vs. ISI
29
Visual Activation Maps (ISI12s)
30
Data Analysis Methods For fMRI
Hypothesis-driven approaches t-test,
cross-correlation, GLM, etc. Data-driven
approaches Principal component analysis (PCA),
independent component analysis (ICA), and
clustering analysis.


